
In today’s digital landscape, understanding web analytics is no longer a luxury, but a necessity. For businesses and individuals alike, harnessing the power of data is crucial for success. This practical guide, “Demystifying Web Analytics: A Practical Guide for Beginners,” offers a comprehensive introduction to the world of web analytics, breaking down complex concepts into easily digestible information. Whether you are a budding entrepreneur, a seasoned marketer, or simply curious about how web analytics works, this guide will equip you with the foundational knowledge and practical skills needed to interpret website data and make informed decisions. From understanding key metrics like bounce rate and conversion rate, to implementing tracking tools and analyzing user behavior, this guide will empower you to unlock the full potential of your website.
This guide provides a clear and concise roadmap to navigating the often-intimidating realm of web analytics. Learn how to leverage data-driven insights to optimize your website’s performance, improve user experience, and ultimately achieve your online objectives. We will explore the core principles of web analytics, introduce essential tools, and provide practical examples to illustrate their application in real-world scenarios. Begin your journey towards mastering web analytics and transforming your online presence today with this essential primer. Discover how web analytics can empower you to make informed decisions, enhance your marketing strategies, and achieve sustainable growth.
What is Web Analytics and Why is it Important?
Web analytics is the process of collecting, analyzing, and interpreting data about website traffic. It provides valuable insights into how users interact with your website, allowing you to make data-driven decisions to improve its performance and achieve your business objectives.
Why is it important? Simply put, web analytics empowers you to understand your audience and their behavior. This understanding is crucial for optimizing your website’s effectiveness. By tracking key metrics, you can identify areas for improvement, such as content that resonates with visitors, user experience bottlenecks, and the effectiveness of marketing campaigns.
Key benefits of web analytics include:
- Improved user experience: By understanding user behavior, you can optimize your website’s design and navigation for a smoother, more engaging experience.
- Increased conversions: Web analytics helps identify areas where users drop off in the conversion funnel, allowing you to address these issues and improve conversion rates.
- Data-driven decision making: Relying on data rather than guesswork allows for more informed decisions about website content, design, and marketing strategies.
- Enhanced marketing ROI: By tracking the effectiveness of marketing campaigns, you can allocate resources more efficiently and maximize your return on investment.
Key Metrics in Web Analytics: Understanding the Basics
Web analytics relies on a core set of metrics to provide insights into website performance. Understanding these key metrics is crucial for interpreting data and making informed decisions.
Website Traffic: This fundamental metric measures the number of visitors to your website. It provides a general overview of your website’s reach and popularity.
Unique Visitors: Unlike website traffic, unique visitors counts each individual user only once, even if they visit multiple times within a specific timeframe. This metric provides a clearer picture of the actual number of people engaging with your site.
Page Views: This metric tracks the total number of pages viewed on your website. A high page view count can indicate engaging content and effective site navigation.
Bounce Rate: This represents the percentage of visitors who leave your website after viewing only one page. A high bounce rate can suggest issues with site design, content relevance, or user experience.
Average Session Duration: This metric measures the average amount of time users spend on your website per visit. Longer session durations can indicate engaging content and a positive user experience.
Setting Up Web Analytics for Your Website
Setting up web analytics is a straightforward process. The most popular choice is Google Analytics, a free and powerful tool. Begin by creating a Google Analytics account and obtaining your unique tracking ID. This ID is a snippet of JavaScript code that needs to be embedded into every page of your website.
Placement of the tracking code is crucial for accurate data collection. Typically, the code is placed within the <head> section of your HTML, just before the closing </head> tag. This ensures the script loads early and tracks all user interactions.
Several content management systems (CMS) simplify this process by offering plugins or integrations that automate the addition of the tracking code. If you’re using a CMS like WordPress, explore these options to streamline the setup. Alternatively, you can manually add the code to your website’s template files.
After implementation, allow some time for data collection to begin. You can then access your website’s analytics reports within the Google Analytics interface to monitor traffic, user behavior, and other key metrics.
Understanding Your Audience Through Web Analytics Data
Web analytics data provides invaluable insights into your audience, allowing you to move beyond simple traffic numbers and understand who your visitors are and how they interact with your website. This knowledge is crucial for tailoring your content, improving user experience, and ultimately achieving your website’s goals.
Demographics like age, gender, and location help paint a picture of your typical visitor. Interests, derived from browsing behavior, reveal what topics and content resonate with your audience. Understanding these aspects enables you to create more targeted and effective marketing campaigns.
Analyzing behavior metrics reveals how users navigate your site. Which pages are most popular? Where are users dropping off? This information can identify areas for improvement, such as confusing navigation or underperforming content.
By understanding the technology your audience uses, like device type (mobile vs. desktop) and browser, you can optimize your website for different platforms, ensuring a seamless experience for everyone.
Using Web Analytics to Improve Website Performance
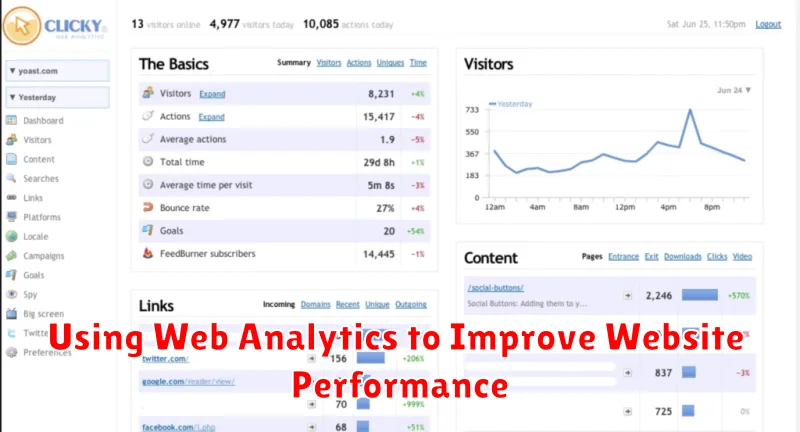
Web analytics data provides invaluable insights that can be directly applied to enhance your website’s performance. By analyzing key metrics, you can identify areas for improvement and make data-driven decisions.
Identifying Bottlenecks: High bounce rates on specific pages can indicate design flaws or confusing content. Long load times revealed through analytics can point to technical issues needing immediate attention. Addressing these bottlenecks improves user experience and encourages engagement.
Content Optimization: Analyze which content performs well and which doesn’t. Pages with high exit rates might need revisions or better calls to action. Understanding content consumption patterns allows you to tailor your content strategy for maximum impact.
Conversion Rate Optimization: Track user flow through your website to pinpoint drop-off points in the conversion funnel. This data allows you to optimize the path to purchase, improving conversion rates and ultimately, your bottom line.
A/B Testing: Utilize analytics to measure the effectiveness of different versions of webpage elements. A/B testing headlines, images, or calls to action, guided by analytics, provides data-backed insights for making informed design choices.
Analyzing User Behavior with Web Analytics Tools
Understanding user behavior is crucial for optimizing website performance and achieving business goals. Web analytics tools provide valuable data insights into how users interact with your website.
Key metrics for analyzing user behavior include:
- Bounce Rate: The percentage of visitors who leave a website after viewing only one page. A high bounce rate may indicate issues with content relevance or user experience.
- Pages/Session: The average number of pages viewed during a single session. This metric reflects user engagement and content exploration.
- Average Session Duration: The average length of time users spend on your website. Longer durations suggest higher levels of interest and engagement.
- Exit Rate: The percentage of visitors who leave your website from a specific page. Analyzing exit rates helps identify potential pain points in the user journey.
By leveraging these metrics, you can identify trends, understand user preferences, and make informed decisions to improve website usability and conversion rates.
Making Data-Driven Decisions with Web Analytics Insights
Web analytics provides a wealth of data, but its true value lies in its ability to drive informed decisions. Analyzing website traffic, user behavior, and conversion rates empowers businesses to optimize their online strategies and achieve tangible results. This data-driven approach eliminates guesswork and replaces it with evidence-based actions.
For example, identifying pages with high bounce rates can lead to content improvements or design adjustments. Understanding the customer journey through conversion funnels allows for targeted optimizations at each stage. Analyzing traffic sources reveals which marketing channels are most effective, enabling strategic budget allocation.
By leveraging web analytics insights, businesses can make informed decisions regarding website design, content creation, marketing campaigns, and overall business strategy. This iterative process of analysis and optimization fosters continuous improvement and drives growth.
Common Web Analytics Mistakes to Avoid
Implementing web analytics effectively requires diligence and attention to detail. Overlooking key aspects can lead to inaccurate data and ultimately, flawed decision-making. Avoid these common pitfalls to ensure you’re gathering reliable and actionable insights.
Not setting clear objectives. Before diving into data, define what you want to achieve. Are you aiming to increase conversions, improve user engagement, or boost brand visibility? Establishing clear goals guides your analysis and ensures you’re tracking the right metrics.
Ignoring data segmentation. Analyzing data in aggregate can obscure important trends. Segment your audience based on demographics, behavior, or acquisition channels to uncover specific areas for improvement.
Focusing solely on vanity metrics. High page views or bounce rates don’t always tell the whole story. Focus on metrics tied to your business objectives, such as conversion rates, customer lifetime value, and return on investment.
Failing to track the right KPIs. Identify the Key Performance Indicators (KPIs) that align with your business goals. Tracking the wrong KPIs can lead to misinterpretations of your website’s performance and hinder effective decision-making.
Best Practices for Effective Web Analytics Reporting
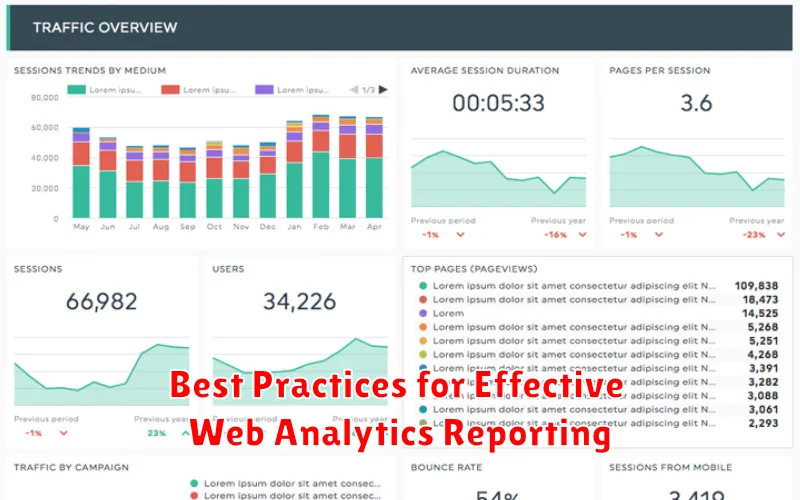
Effective web analytics reporting goes beyond simply presenting data; it’s about delivering actionable insights. Follow these practices to maximize the impact of your reports:
Define Clear Objectives
Start by establishing specific, measurable, achievable, relevant, and time-bound (SMART) goals. Knowing what you want to achieve will guide your reporting and ensure you track the right metrics.
Choose Relevant Metrics
Focus on key performance indicators (KPIs) that directly align with your objectives. Don’t get bogged down in vanity metrics that don’t provide meaningful information.
Visualize Data Effectively
Use charts and graphs to present data clearly and concisely. Choose the visualization that best represents the data and highlights key trends and patterns.
Provide Context and Analysis
Don’t just present numbers; explain what they mean. Offer analysis and interpretation to provide context and highlight the significance of the findings.
Regular Reporting and Monitoring
Establish a consistent reporting schedule to monitor progress and identify areas for improvement. Regular monitoring helps ensure your website is performing optimally.